
Businesses collect and store an unimaginable amount of data, but how do they turn all that data into insights that help them build a better business? Data mining, the process of sifting through massive amounts of data to identify hidden business trends or patterns, makes these transformational business insights possible.
Data mining is not a new technology. Its roots have been traced to the 1930s, according to Hacker Bits, but the term became more widely used in the 1990s as businesses attempted to grapple with the ever-increasing amount of data our society was producing to derive value from it.
The advent of modern computers and application of data mining techniques meant businesses could finally analyze exponential amounts of data and extract non-intuitive, valuable insights; forecasting likely business outcomes, mitigating risks, and taking advantage of newly identified opportunities.
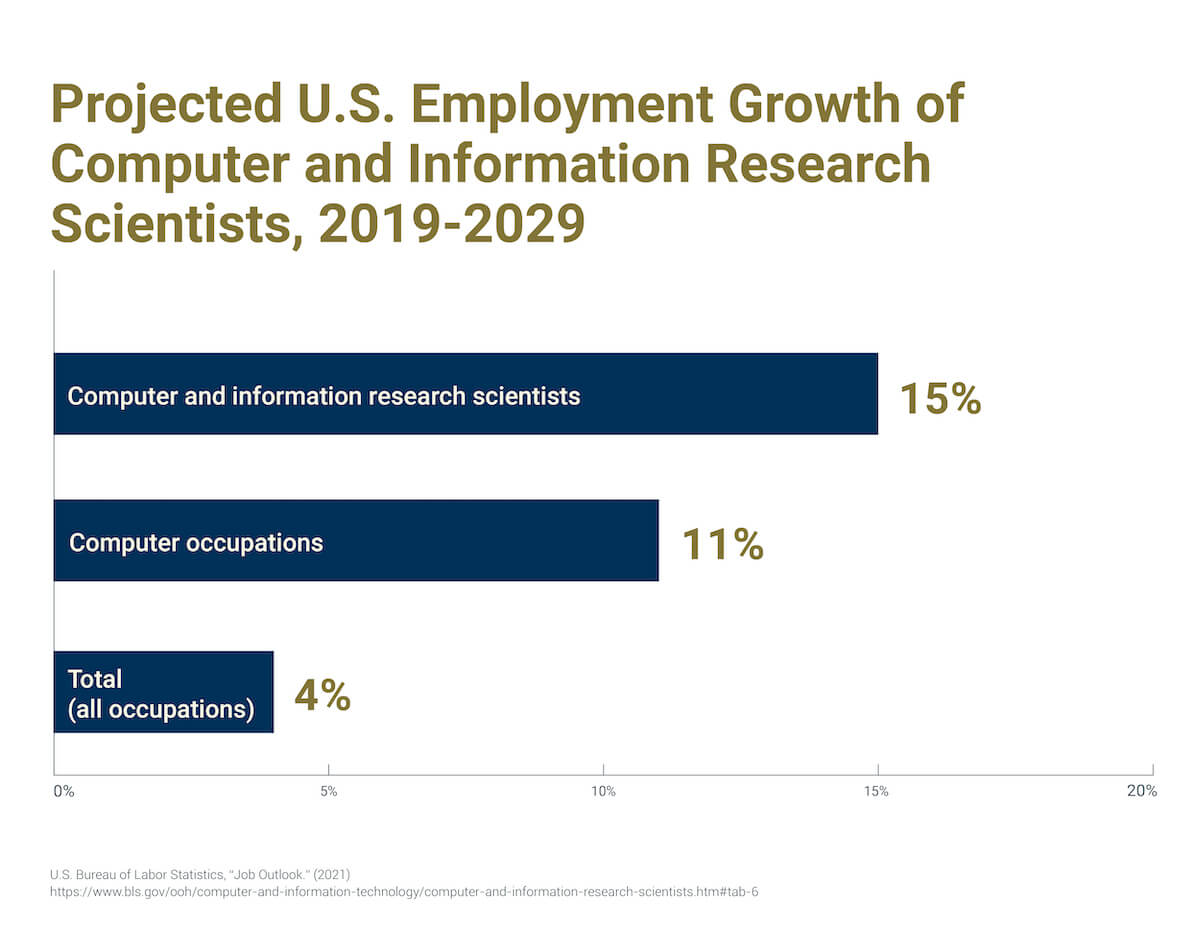
Due to its usefulness across many industries, and its critical role in business success, data mining is a promising career path. Companies need data scientists skilled in mining techniques who can present their findings in understandable ways. According to the U.S. Bureau of Labor Statistics, employment for computer and information research scientists is expected to climb by 15 percent through 2029.
So what are the key techniques that aspiring data miners should know? Here are 10 data mining techniques that we will explore in detail:
- Clustering
- Association
- Data Cleaning
- Data Visualization
- Classification
- Machine Learning
- Prediction
- Neural Networks
- Outlier Detection
- Data Warehousing
If you’re interested in pursuing a data science career, read on to learn more about these data mining methods and how they can lead to success in different industries.
10 Data Mining Techniques
1. Clustering
Clustering is a technique used to represent data visually — such as in graphs that show buying trends or sales demographics for a particular product.
What Is Clustering in Data Mining?
Clustering refers to the process of grouping a series of different data points based on their characteristics. By doing so, data miners can seamlessly divide the data into subsets, allowing for more informed decisions in terms of broad demographics (such as consumers or users) and their respective behaviors.
Methods for Data Clustering
- Partitioning method: This involves dividing a data set into a group of specific clusters for evaluation based on the criteria of each individual cluster. In this method, data points belong to just one group or cluster.
- Hierarchical method: With the hierarchical method, data points are a single cluster, which are grouped based on similarities. These newly created clusters can then be analyzed separately from each other.
- Density-based method: A machine learning method where data points plotted together are further analyzed, but data points by themselves are labeled “noise” and discarded.
- Grid-based method: This involves dividing data into cells on a grid, which then can be clustered by individual cells rather than by the entire database. As a result, grid-based clustering hase a fast processing time.
- Model-based method: In this method, models are created for each data cluster to locate the best data to fit that particular model.
Examples of Clustering in Business
Clustering helps businesses manage their data more effectively. For example, retailers can use clustering models to determine which customers buy particular products, on which days, and with what frequency. This can help retailers target products and services to customers in a specific demographic or region.
Clustering can help grocery stores group products by a variety of characteristics (brand, size, cost, flavor, etc.) and better understand their sales tendencies. It can also help car insurance companies that want to identify a set of customers who typically have high annual claims in order to price policies more effectively. In addition, banks and financial institutions might use clustering to better understand how customers use in-person versus virtual services to better plan branch hours and staffing.
2. Association
Association rules are used to find correlations, or associations, between points in a data set.
What Is Association in Data Mining?
Data miners use association to discover unique or interesting relationships between variables in databases. Association is often employed to help companies determine marketing research and strategy.
Methods for Data Mining Association
Two primary approaches using association in data mining are the single-dimensional and multi-dimensional methods.
- Single-dimensional association: This involves looking for one repeating instance of a data point or attribute. For instance, a retailer might search its database for the instances a particular product was purchased.
- Multi-dimensional association: This involves looking for more than one data point in a data set. That same retailer might want to know more information than what a customer purchased — such as their age, method of purchase (cash or credit card), or age.
Examples of Association in Business
The analysis of impromptu shopping behavior is an example of association — that is, retailers notice in data studies that parents shopping for childcare supplies are more likely to purchase specialty food or beverage items for themselves during the same trip. These purchases can be analyzed through statistical association.
Association analysis carries many other uses in business. For retailers, it’s particularly helpful in making purchasing suggestions. For example, if a customer buys a smartphone, tablet, or video game device, association analysis can recommend related items like cables, applicable software, and protective cases.
Additionally, association is used by the government to employ census data and plan for public services; it is also used by doctors to diagnose various illnesses and conditions more effectively.
3. Data Cleaning
Data cleaning is the process of preparing data to be mined.
What Is Data Cleaning in Data Mining?
Data cleaning involves organizing data, eliminating duplicate or corrupted data, and filling in any null values. When this process is complete, the most useful information can be harvested for analysis.
Methods for Data Cleaning
- Verifying the data: This involves checking that each data point in the data set is in the proper format (e.g, telephone numbers, social security numbers).
- Converting data types: This ensures data is uniform across the data set. For instance, numeric variables only contain numbers, while string variables can contain letters, numbers, and characters.
- Removing irrelevant data: This clears useless or inapplicable data so full emphasis can be placed on necessary data points.
- Eliminating duplicate data points: This helps speed up the mining process by boosting efficiency and reducing errors.
- Removing errors: This eliminates typing mistakes, spelling errors, and input errors that could negatively affect analysis outcomes.
- Completing missing values: This provides an estimated value for all data and reduces missing values, which can lead to skewed or incorrect results.
Examples of Data Cleaning in Business
According to Experian, 95 percent of businesses say they have been impacted by poor data quality. Working with incorrect data wastes time and resources, increases analysis costs (because models need to be repeated), and often leads to faulty analytics.
Ultimately, no matter how great their models or algorithms are, businesses suffer when their data is incorrect, incomplete, or corrupted.
4. Data Visualization
Data visualization is the translation of data into graphic form to illustrate its meaning to business stakeholders.
What Is Data Visualization in Data Mining?
Data can be presented in visual ways through charts, graphs, maps, diagrams, and more. This is a primary way in which data scientists display their findings.
Methods for Data Visualization
Many methods exist for representing data visually. Here are a few:
- Comparison charts: Charts and tables express relationships in the data, such as monthly product sales over a one-year period.
- Maps: Data maps are used to visualize data pertaining to specific geographic locations. Through maps, data can be used to show population density and changes; compare populations of neighboring states, counties, and countries; detect how populations are spread over geographic regions; and compare characteristics in one region to those in other regions.
- Heat maps: This is a popular visualization technique that represents data through different colors and shading to indicate patterns and ranges in the data. It can be used to track everything from a region’s temperature changes to its food and pop culture trends.
- Density plots: These visualizations track data over a period of time, creating what can look like a mountain range. Density plots make it easy to represent occurrences of single events over time (e.g., month, year, decade).
- Histograms: These are similar to density plots but are represented by bars on a graph instead of a linear form.
- Network diagrams: These diagrams show how data points relate to each other by using a series of lines (or links) to connect objects together.
- Scatter plots: These graphs represent data point relationships on a two-variable axis. Scatter plots can be used to compare unique variables such as a country’s life expectancy or the amount of money spent on healthcare annually.
- Word clouds: These graphics are used to highlight specific word or phrase instances appearing in a body of text; the larger the word’s size in the cloud, the more frequent its use.
Examples of Data Visualization in Business
Representing data visually is an important skill because it makes data readily understandable to executives, clients, and customers. According to Markets and Markets, the market size for global data visualization tools is expected to nearly double (to $10.2 billion) by 2026.
Companies can make faster, more informed decisions when presented with data that is easy to understand and interpret. Today, this is typically accomplished through effective, visually accessible mediums such as graphs, 3D models, and even augmented reality. As a result, it’s a good idea for aspiring data professionals to consider learning such skills through a data science and visualization bootcamp.
5. Classification
Classification is a fundamental technique in data mining and can be applied to nearly every industry. It is a process in which data points from large data sets are assigned to categories based on how they’re being used.
What Is Classification in Data Mining?
In data mining, classification is considered to be a form of clustering — that is, it is useful for extracting comparable points of data for comparative analysis. Classification is also used to designate broad groups within a demographic, target audience, or user base through which businesses can gain stronger insights.
Methods for Data Mining Classification
- Logistic regression: This algorithm attempts to show the probability of a specific outcome within two possible results. For example, an email service can use logistic regression to predict whether or not an email is spam.
- Decision trees: Once data is classified, follow-up questions can be asked, and the results diagrammed into a chart called a decision tree. For example, if a computer company wants to predict the likelihood of laptop purchases, it may ask, Is the potential buyer a student? The data is classified into “Yes” and “No” decision trees, with other questions to be asked afterward in a similar fashion.
- K-nearest neighbors (KNN): This is an algorithm that tries to identify an unknown object by comparing it to others. For instance, grocery chains might use the K-nearest neighbors algorithm to decide whether to include a sushi or hot meals station in their new store layout based on consumer habits in the local marketplace.
- Naive Bayes: Based on the Bayes Theorem of Probability, this algorithm uses historical data to predict whether similar events will occur based on a different set of data.
- Support Vector Machine (SVM): This machine learning algorithm is often used to define the line that best divides a data set into two classes. An SVM can help classify images and is used in facial and handwriting recognition software.
Examples of Classification in Business
Financial institutions classify consumers based on many variables to market new loans or project credit card risks. Meanwhile, weather apps classify data to project snowfall totals and other similar figures. Grocery stores also use classification to group products by the consumers who buy them, helping forecast buying patterns.
6. Machine Learning
Machine learning is the process by which computers use algorithms to learn on their own. An increasingly relevant part of modern technology, machine learning makes computers “smarter” by teaching them how to perform tasks based on the data they have gathered.
What Is Machine Learning in Data Mining?
In data mining, machine learning’s applications are vast. Machine learning and data mining fall under the umbrella of data science but aren’t interchangeable terms. For instance, computers perform data mining as part of their machine learning functions.
Methods for Machine Learning
- Supervised learning: In this method, algorithms train machines to learn using pre-labeled data with correct values, which the machines then classify on their own. It’s called supervised because the process trains (or “supervises”) computers to classify data and predict outcomes. Supervised machine learning is used in data mining classification.
- Unsupervised learning: When computers handle unlabeled data, they engage in unsupervised learning. In this case, the computer classifies the data itself and then looks for patterns on its own. Unsupervised models are used to perform clustering and association.
- Semi-supervised learning: Semi-supervised learning uses a combination of labeled and unlabeled data, making it a hybrid of the above models.
- Reinforcement learning: This is a more layered process in which computers learn to make decisions based on examining data in a specific environment. For example, a computer might learn to play chess by examining data from thousands of games played online.
Examples of Machine Learning in Business
With machine learning, companies can use computers to quickly identify all sorts of data patterns (in sales, product usage, buying habits, etc.) and develop business plans using those insights. This is a growing need in many industries.
According to a MicroStrategy survey, 18 percent of analytics professionals said machine learning and AI will have the most significant impact on their strategies over the next five years. Learning more advanced topics like machine learning is thus becoming imperative for data scientists.
7. Neural Networks
Computers process large amounts of data much faster than human brains but don’t yet have the capacity to apply common sense and imagination in working with the data. Neural networks are one way to help computers reason more like humans.
What Are Neural Networks in Data Mining?
Artificial neural networks attempt to digitally mimic the way the human brain operates. Neural networks combine many computer processors (similar to the way the brain uses neurons) to process data, make decisions, and learn as a human would — or at least as closely as possible.
Neural Network Methods
Neural networks consist of three main layers: input, “hidden,” and output. Data enters through the input layer, is processed in the hidden layer, and is resolved in the output layer where any relevant action based on the data is then taken. The hidden layer can consist of many processing layers, depending on the amount of data being used and learning taking place.
Supervised and unsupervised learning also apply to neural networks; neural networks use these types of algorithms to “train” themselves to function in ways similar to the human brain.
Examples of Neural Networks in Business
Neural networks have a wide range of applications. They can help businesses predict consumer buying patterns and focus marketing campaigns on specific demographics. They can also help retailers make accurate sales forecasts and understand how to use dynamic pricing. Furthermore, they help to improve diagnostic and treatment methods in healthcare, improving care and performance.
8. Outlier Detection
Outlier detection is a key component of maintaining safe databases. Companies use it to test for fraudulent transactions, such as abnormal credit card usage that might suggest theft.
What Is Outlier Detection in Data Mining?
While other data mining methods seek to identify patterns and trends, outlier detection looks for the unique: the data point or points that differ from the rest or diverge from the overall sample. Outlier detection finds errors, such as data that was input incorrectly or extracted from the wrong sample. Natural data deviations can be instructive as well.
Methods for Outlier Detection
- Numeric outlier: Outliers are detected based on the Interquartile Range, or the middle 50 percent of values. Data points outside that range are considered outliers.
- Z-score: The Z-Score denotes how many standard deviations a data point is from the sample’s mean. This is also known as extreme value analysis.
- DBSCAN: This stands for “density-based spatial clustering of applications with noise” and is a method that defines data as core points, border points, and noise points, which are the outliers.
- Isolation forest: This method isolates anomalies in large sets of data (the forest) with an algorithm that searches for those anomalies instead of profiling normal data points.
Examples of Outlier Detection in Business
Almost every business can benefit from understanding anomalies in their production or distribution lines and how to fix them. Retailers can use outlier detection to learn why their stores witness an odd increase in purchases, such as snow shovels being bought in the summer, and how to respond to such findings.
Generally, outlier detection is employed to enhance logistics, instill a culture of preemptive damage control, and create a smoother environment for customers, users, and other key groups.
9. Prediction
Predictive modeling seeks to turn data into a projection of future action or behavior. These models examine data sets to find patterns and trends, then calculate the probabilities of a future outcome.
What Is Prediction in Data Mining?
Predictive modeling is among the most common uses of data mining and works best with large data sets that represent a broad sample size.
Methods for Prediction
Predictive modeling uses some of the same techniques and terminology as other data mining processes. Here are four examples:
- Forecast modeling: This is a common technique in which the computer answers a question (for instance, How much milk should a store have in stock on Monday?) by analyzing historical data.
- Classification modeling: Classification places data into groups where it can be used to answer direct questions.
- Cluster modeling: By clustering data into groups with shared characteristics, a predictive model can be used to study those data sets and make decisions.
- Time series modeling: This model analyzes data based on when the data was input. A study of sales trends over a year is an example of time series modeling.
Examples of Prediction in Business
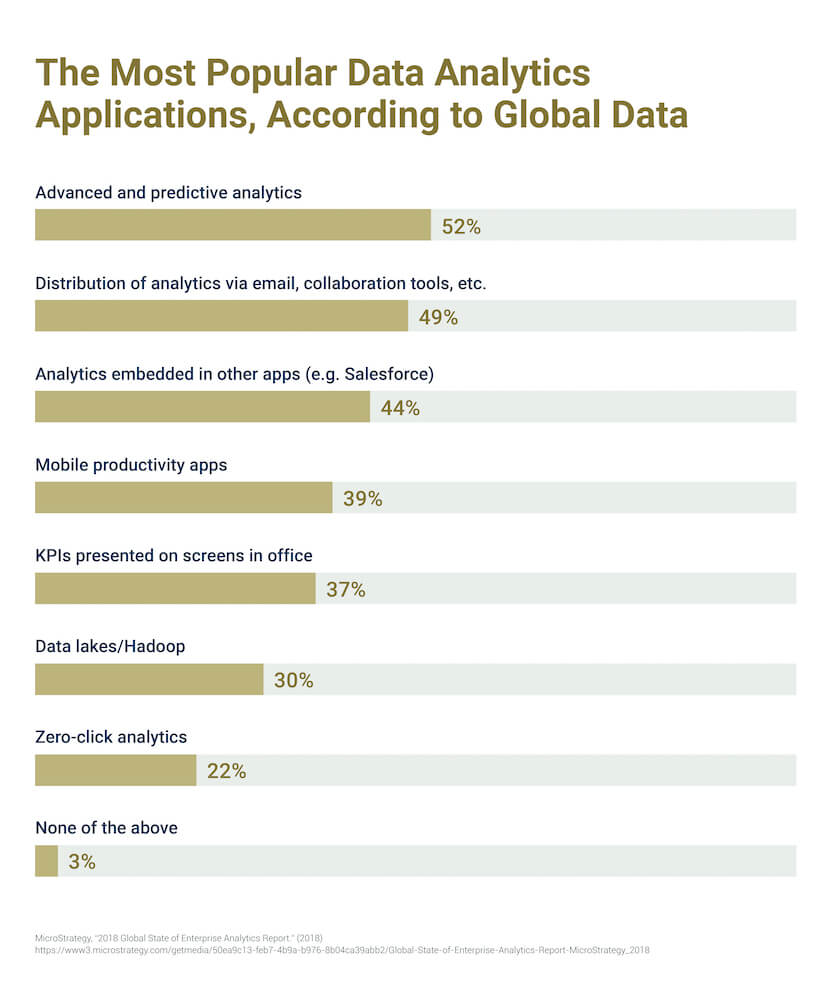
Predictive modeling is a business imperative that impacts nearly every corner of the public and private sectors. According to MicroStrategy, 52 percent of global businesses consider advanced and predictive modeling their top priority in analytics.
Predictive models can be built to determine sales projections and predict consumer buying habits. They help manufacturers forecast distribution needs and determine maintenance schedules. Government agencies use census data to map population trends and project spending needs while baseball teams use predictive models to determine contracts and build rosters.
10. Data Warehousing
Data warehousing is the process by which data is collected and stored before it is evaluated.
What Is Data Warehousing in Data Mining?
Data miners collect data from multiple sources into a common archive before it can be used in business analysis. This process, called data warehousing, typically occurs before the data mining process.
Methods for Data Warehousing
Data goes through a three-stage process known as ETL before being loaded into a data warehouse. ETL stands for extract, transform, and load:
- Extract: Data is copied and moved from its source to a warehouse staging area. Data can be structured (names, dates, credit card numbers, etc.) or unstructured (photos, videos, audio files, social media posts).
- Transform: In this step, the data is filtered and cleaned — errors are removed and the data is validated. The data is also formatted to fit the warehouse.
- Load: In the final step, the transformed data is uploaded to the data warehouse. These steps can be repeated as data is updated.
Examples of Data Warehousing in Business
Data warehouses make working with big data easier — particularly for businesses that deal with large customer bases, sales and billing reports, and resource plans. Through data warehousing, businesses can segment and target customers from vast collections of sales orders, product searches, or loyalty program registrations. They also can store and analyze a wide variety of data points, even social media posts about products and businesses.
Data warehousing also consolidates various data sources into one place, making mining and decision-making more efficient and saving businesses time and money.
Conclusion
Businesses looking for a competitive advantage often find data to be among their best resources, and data mining techniques are vital in bringing this resource to fruition. Mining allows businesses to harness the power of data, gain insight, detect patterns and anomalies, and find ways to be more productive.
As we continue to produce a growing amount of diverse data, the ability to mine that data for insights will become increasingly important. Organizations generally want faster, more efficient ways to work with their data, more methods to visualize data, and computing systems that can make more human-like decisions.
As a result, many companies expect to increase their investment in analytics initiatives, which includes data mining. According to MicroStrategy’s 2018 Global State of Enterprise Analytics Report, 71 percent of global companies say they plan to spend more money on analytics (with 73 percent of U.S. companies intending to increase their analytics budgets).
As a result, data science and visualization is a promising career path, and a data science and analytics bootcamp is a great way to learn the technical skills needed to solve complex data problems and visualize solutions. Bootcamps cover necessary skills such as statistical modeling, database programming languages, and business intelligence software. They also afford the opportunity to gain practical experience through real-world projects.
Data Mining Techniques FAQ
Aspiring data miners may still have a few lingering questions as they enter the field. Here are a few key points of summary:
What data mining techniques should I learn?
There are numerous crucial data mining techniques to consider when entering the data field, but some of the most prevalent methods include clustering, data cleaning, association, data warehousing, machine learning, data visualization, classification, neural networks, and prediction. Each of these techniques comprises an important aspect of data mining.
What is data mining?
Broadly speaking, data mining is the computer-driven process of exploring data sets, pinpointing key trends and anomalies, and subsequently analyzing these findings to form conclusions and make better decisions. Data mining is used in countless industries as a means of improving efficiency, developing crucial consumer insights, and innovating on existing business models.
What are data mining techniques used for?
There are many common data mining techniques, and each addresses a different aspect of data collection and analysis. For instance, outlier detection is used to identify critical abnormalities in data that could be indicative of a deeper issue. Meanwhile, predictive modeling is instrumental in developing more informed future plans based on existing findings.
What are the different types of data mining?
Categorically, data mining methods can range from pattern-based (clustering, classification, association) and anomaly-focused (outlier detection) to automated (neural networks, machine learning). In most cases, the type of data mining will depend on the entity using it and the data in question.
This article was originally published on bootcamp.pe.gatech.edu.